


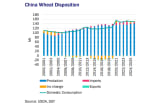
China is the largest producer and consumer of wheat in the world. In the 2024/25 marketing year, which runs until the end of June, the USDA estimates that China will produce 140 Mt (the largest on record), consume 150 Mt and import 3.3Mt. Over the last ten years production has grown from 133 Mt, and consumption has grown from 118 Mt. During this time imports climbed sharply too – from 3.5 Mt imported in 2015/16, Chinese imports averaged 11.8 Mt per marketing year between 2020/21 and 2023/24 (peaking at 13.6 Mt that year).
Following a sharp uptick in 2020/21 from 126 Mt to 155 Mt, growth in domestic consumption has flatlined. The surge in 2020/21 was largely down to an uptick in use for animal feed – seven consecutive years of higher production than consumption had left wheat inventories swollen at 150 Mt (119% of the previous year’s total consumption). Conversely, corn — the preferred grain for animal feed — had suffered three years of production below consumption leaving corn inventories at a five-year low, down 23 Mt from the 2017/18 peak.
Livestock farmers substituted much of the corn in their animal feed with wheat that year leading to a spike in the feed consumption of wheat. However, in the years that followed, while feed consumption remained above pre-2020/21 levels, at an average of 34.5 Mt per marketing year, this was still 23% below the peak. Although human consumption of wheat has continued to grow, the Chinese population has been shrinking since 2021, and with the pace of decline expected to accelerate this could continue to weigh on consumption.
On the other hand wheat production growth seems inexorable (allowing for the usual volatility in grain production thanks to weather events). Yields have risen from 3.7 tonnes per hectare in 2000/01 to an estimate of 5.9 tonnes per hectare currently. Some Chinese estimates put the practical ceiling around 9 t/ha, but this would put China on a par with New Zealand, with the highest yields in the world in 2024/25 at 10.1 t/ha and above the UK, the second highest at 7.2 t/ha. Acreage has been flat since 2020/21 at around 23.5 million hectare.

The Chinese government has vowed to support grain production and high inventory levels in order to increase food security. With wheat in particular, they aren’t far off achieving this goal. Despite the predicted 8 Mt drop in ending stocks this year, they remain at 85% of the USDA forecast for consumption in 2025/26, compared to 62% for corn. Hence, Chinese production looks able to cover domestic consumption, with large stockpiles providing a buffer in years when crop yields are poorer.
All this is potentially bad news for Australian and Canadian wheat farmers, making up 30% and 23% of Chinese imports, respectively, in the 2024 calendar year. In the first four months of this year Australian exports to China fell 79% y-o-y to 568 Kt, while total exports fell 6.1% y-o-y, despite a USDA production forecast for this year up 31% y-o-y at 34.1 Mt. Canadian exports to China tell a similar story, down 35% y-o-y to 946 Kt, although total Canadian exports are up y-o-y with increases in exports to the EU (up 57% y-o-y), the US (up 39% y-o-y) and South America (up 39% y-o-y), more than offsetting the loss.
The shift in destinations for Canadian wheat is clearly negative for tonne-mile demand, as is a loss of trade from Australia. When the new Australian crop is harvested in Q4 the unsold wheat will need to find a home to free up space in silos. The vessel demand prospects then depend on where this wheat will go — so far this year there has been growth in wheat trade to the Philippines (up 82% y-o-y to 1.2 Mt), Thailand (up 280% y -o-y to 1.0 Mt) and Africa (up 127% y-o-y to 0.9 Mt). Trade to these regions is predominantly on Supramaxes compared to the China trade which is largely done on Panamaxes.
By William Tooth, Senior Dry Bulk Analyst, Research, SSY.
Articles
You may also be
interested in
View all


Get in touch
Contact us today to find out how our expert team can support your business