











The divergence highlighted last week resolved in a brief bounce rather than a sustained reversal: the candle recorded on 8 October is a bearish shooting star, with a narrow open and close (open $41,075, close $40,875) and a wide trading range (low $40,000, high $42,500). The subsequent fall has been sharp and on raised volume, but so far there has been no close below the $37,700 level — that may change today. All momentum indicators are bearish, and RSI has yet to break into oversold territory below 30. The next support level, $35,650, is drawn from July’s highs on the November contract, though volume was thin at the time. Assuming today closes below $37,700, that level will become resistance from tomorrow.
To download the latest edition of SSY’s Technical Analysis, visit SSY Navigator.
To subscribe, contact navigator@ssyglobal.com
Articles
You may also be
interested in
View all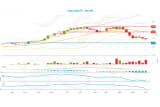


Get in touch
Contact us today to find out how our expert team can support your business