











In hindsight, the rally in Capesize August truly ended on 14 July and there were early signs of a decline in the divergence of OBV and RSI. All indicators have now turned negative, but it’s worth noting that OBV hit its lowest point on 16 July before setting a higher low on 20 July. RSI so far today is also higher than the low of yesterday. The key price level to watch is $31,250 – a close above here coupled with climbing RSI and OBV would be a strong indication that a floor has been found.
To download the latest edition of SSY’s Technical Analysis, visit SSY Navigator.
To subscribe, contact navigator@ssyglobal.com
Articles
You may also be
interested in
View all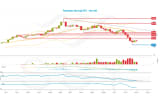

Get in touch
Contact us today to find out how our expert team can support your business