


A month into 2026 and the chemical tanker market is starting to feel more acutely the effects of weak downstream demand and oversupply with tonnage. Besides biofuels where demand is supported by government mandates and policies, the other bright spot in this otherwise gloomy market is specialty chemicals. Demand for specialty chemicals is expected to grow by 3-4% in 2026, outpacing demand for other chemicals. Strict quality requirements during transportation make this segment of the chemical trade less price-elastic and able to bear higher transportation costs, which makes it an important revenue generator for shipowners.
With about 1M mt/year methyl methacrylate (MMA) is one of the commonly moved specialty chemicals. Its number one use is in the production of the polymethyl methacrylate (PMMA) which takes up more than 75% of the global MMA volumes. PMMA then flows into big-end use sectors like construction, automotive/transport, electronics, lighting, healthcare where it is used for plastics, screens, displays, surface coatings, etc. Thus, the health of the MMA market is very heavily dependent on the health of downstream demand in these sectors.
From supply perspective, most of the global production capacity is concentrated in Asia, followed by the US and then Europe. In Asia several countries have MMA plants – China, Japan, Korea, Taiwan, Singapore and Thailand. However, over the past year there have been partial closures at PTT Asahi’s plant in Thailand and Sumitomo’s plant in Singapore which has led to China emerging as the leading MMA supplier in both the regional and deep-sea markets.
But how has the MMA trade developed over the years and in 2025 in particular? And what to expect from 2026?
The Bigger Picture
Looking at trade data for the period 2014-24 shows that exports have been mostly flat to down – moving from ~975K mt in 2014 to 800-940K mt range between 2015-21, then ~850-880K mt in 2022-23, before jumping to over a 1M mt in 2024, driven by a surge in Chinese exports.
The big structural shift has been the re-orientation of trade away from intra-NE Asia flows (as China/NE Asia become more self-sufficient) and towards Europe, North America, India and ASEAN – which is exactly where downstream demand has been more supportive. A brief regional overview below:
- NE Asia has seen import compression and expansion of MMA exports. China’s construction/property weakness and chemical margin pressure have pushed producers to export, while new capacity has reduced the need for imports.
- India and SE Asia have experienced steady pull from construction, manufacturing and electronics. India imports have nearly doubled from 49K mt to almost 100K mt/year, while ASEAN is steady-to-up from 215K mt to about 240K mt/year. These are exactly the regions where the downstream, end users of MMA have been generally healthier than Europe or China.
- In Europe the story has been big import growth (from ~150K mt to more than 330K mt/year) despite “underwhelming” end-use. Weak construction and auto demand have been plaguing the European market for the past several years while cheaper imports from Asia (predominantly China) have won market share. This has resulted in a long supply environment on the Old Continent.
- North America (as importer region) has increased strongly its MMA imports (from 55K mt to above 140K mt/year).
Shifts in MMA Trades
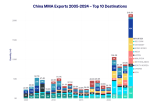
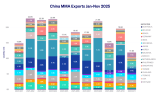
China
China’s emergence as the dominant global exporter of MMA accelerated sharply in 2024, when shipments surged to ~316 kt, up from ~146 kt in 2023 and less than 60 kt annually before 2021. Early 2025 data indicate that this export role remains structural but no longer accelerating at the same pace. Chinese exports totaled ~204 kt over January–November 2025, implying a full-year run rate broadly below 2024 levels, though still far above any other supplier. This moderation suggests that while China continues to act as the global balancing supplier, the scale of incremental surplus available for export has stabilized rather than expanded further. Destination patterns in 2025 continue to favor India, Southeast Asia and Europe, confirming that exports remain a function of weak domestic absorption—particularly in construction-linked PMMA and coatings—rather than short-term arbitrage. Into 2026, China is therefore expected to retain its role as the marginal supplier, but with export volumes increasingly governed by downstream demand conditions in importing regions rather than continued capacity-driven growth.
Japan
Japan’s long-term export decline from ~182 kt in 2014 to ~115 kt in 2024 is reinforced by 2025 data, which show exports of ~67 kt over January–November, broadly consistent with a flat-to-slightly lower full-year outcome. The destination mix in 2025 remains concentrated in Southeast Asia and selected Northeast Asian markets, reflecting Japan’s exposure to manufacturing, electronics and coatings demand rather than property-driven PMMA consumption. The absence of any rebound in export volumes in 2025 confirms that Japan has structurally exited the role of swing exporter and is now supplying a narrower, more stable regional demand base. This positioning is expected to persist into 2026, with limited sensitivity to global price movements.


South Korea
South Korean MMA exports declined from ~63 kt in 2014 to ~52 kt in 2024, and 2025 shipments of ~40 kt over January–November point to a further easing. Exports remain increasingly directed toward the United States and Europe, reinforcing Korea’s exposure to Western downstream sectors where construction, automotive and coatings demand remain subdued. The continued softening in 2025 suggests that Korea’s export role is becoming more marginal, with volumes likely to remain opportunistic and capped in 2026.


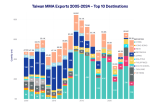
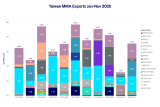
Taiwan
Taiwan’s exports eased from ~85 kt in 2014 to ~74 kt in 2024, and 2025 data show ~79 kt shipped over January–November, suggesting a modest year-on-year increase. This improvement is driven almost entirely by Southeast Asian demand, particularly from manufacturing and electronics-related applications, while shipments to China remain secondary. The 2025 data therefore support the view that Taiwan’s export position is stable and ASEAN-oriented, with limited exposure to property-driven PMMA cycles. This pattern is expected to continue into 2026.
Singapore
Singapore’s export contraction from ~168 kt in 2014 to ~91 kt in 2024 is confirmed by 2025 data, which show shipments of ~61 kt over January–November, pointing to a further year-on-year decline. The 2025 flows remain concentrated in India and Southeast Asia, but total volumes are clearly constrained by reduced availability rather than demand. This reinforces the view that Singapore’s diminished role is structural, reflecting capacity rationalization and partial closures rather than cyclical weakness. As a result, Singapore’s contribution to global MMA supply is expected to remain limited in 2026, tightening non-Chinese Asian export options.


Thailand
Thailand’s exports fell from ~145 kt in 2014 to ~90 kt in 2024, and 2025 data indicate continued contraction, with ~56 kt shipped over January–November. As in 2024, the majority of volumes were absorbed within Southeast Asia, particularly Malaysia and Indonesia, underlining Thailand’s transition to a predominantly regional supplier. The lack of recovery in 2025 supports the view that Thai exports are structurally constrained by capacity rationalization, rather than temporarily depressed by demand. This reinforces expectations of a reduced Thai presence in global MMA trade in 2026.


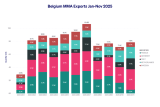
Belgium
Belgian exports rose steadily from ~51 kt in 2014 to ~96 kt in 2024, and early 2025 data suggest a broadly stable profile. Shipments reached ~88 kt over January–November 2025, indicating that volumes are holding near recent highs despite weak underlying European demand. This confirms Belgium’s role as a regional balancing supplier within Europe rather than a proxy for end-use growth. However, the absence of further growth in 2025 highlights increasing competition from imported Asian material, particularly from China, which continues to cap upside for intra-European exporters heading into 2026.

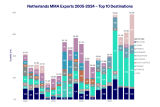
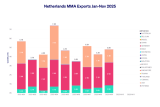
Netherlands
Dutch MMA exports increased from ~68 kt in 2014 to ~91 kt in 2024, but 2025 data show a moderation, with ~43 kt exported in the first eleven months, implying a lower full-year total. This reflects reduced arbitrage activity rather than a structural shift in production, consistent with the Netherlands’ role as a logistics and redistribution hub. As price differentials narrowed in 2025, export volumes adjusted accordingly. This reinforces the view that Dutch exports remain highly sensitive to freight and pricing economics and are unlikely to signal underlying demand recovery in 2026.
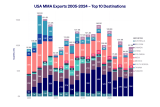
United States
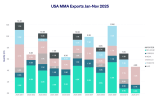
US MMA exports declined from ~181 kt in 2014 to ~112 kt in 2024, and 2025 data suggest a broadly similar level of export availability. Shipments totaled ~95 kt in the first eleven months of 2025, implying a full-year outcome close to 2024 levels. Export flows continue to be dominated by Canada and Mexico, with Europe acting as a secondary outlet. The stability of exports in 2025, despite subdued domestic downstream conditions, indicates that US producers are maintaining operating discipline and managing inventories rather than actively pushing surplus volumes abroad. As such, US exports remain residual and balance-driven, with little indication of a structural expansion in global trade participation heading into 2026.
How MMA’s changing trade map has changed tonne-miles
From a chemical tanker demand perspective, the key point is that MMA export tonnes did not grow much between 2014 and 2024, but the average haul length increased materially as flows reoriented away from intra-Asia balancing and toward long-haul destinations. Global MMA exports were ~975 kt in 2014 and ~1,037 kt in 2024 (only ~6% higher), yet the trade pattern moved sharply toward longer voyages: Asia/Europe volumes rose from roughly ~21 kt (2014) to ~138 kt (2024), and Asia/North America rose from ~12 kt to ~74 kt, while intra-Asia movements fell from ~628 kt to ~466 kt over the same period. Put differently, a smaller share of the market is now “short haul Asia-to-Asia”, and a larger share is “long haul Asia-to-West”. Using conservative distance buckets for major basins, that mix shift implies that global MMA tonne-mile demand rising far faster than tonne demand—a structural positive for chemical tankers, because ships are tied up longer per tonne moved and effective fleet supply tightens even without any change in the number of vessels.
Why the effect is amplified for the specialty / stainless parcel fleet
The impact is even more pronounced for the specialty chemical tanker market, because longer haul MMA flows tend to sit inside parcel trades (often combined with other chemicals) that require more segregations, higher tank cleanliness standards, and, for many specialty cargoes carried alongside (or on the same ship rotation), stainless steel tanks. Even where MMA itself can be carried in coated tanks depending on spec and charterer requirements, the way the trade is executed—as part of multi-grade, high service-factor parcel liftings—pushes it into the operating envelope where stainless ships compete for the same long-haul employment. The change in exporter structure reinforces this: the surge in China’s exports in 2024 (to ~316 kt) and its still-large 2025 position (about ~204 kt Jan–Nov) means the market is increasingly supplied from a geography that naturally feeds into deep-sea parcel distribution into Europe and North America, rather than being absorbed regionally. That is a direct tonne-mile tailwind for stainless and high-spec IMO II chemical tankers because it increases voyage duration, ballast legs, and scheduling complexity—raising utilization and supporting freight, especially when stainless availability is already tight.
What 2025 data says about the “tone-miles vs tonnes” dynamic
2025 export data (Jan–Nov) suggests the pattern persists, but at a more measured pace than the 2024 step-change. China remains the largest exporter (~204 kt Jan–Nov), but several non-China Asian exporters are lower (e.g., Singapore ~61 kt, Thailand ~56 kt Jan–Nov), consistent with reduced regional availability and more reliance on China for balancing. Critically for shipping, Asia/Europe is still substantial (~71 kt Jan–Nov 2025) and Asia/North America remains meaningful (~39 kt Jan–Nov 2025), while intra-Asia is still the largest block (~377 kt Jan–Nov 2025). In shipping terms, that’s a market that continues to carry a structurally higher long-haul share than in the mid-2010s, even if 2025 does not repeat the same explosive long-haul growth rate seen from 2020–2024. The net is that MMA continues to “punch above its weight” in tonne-miles relative to tonnes because the long-haul lanes remain much more important than they used to be.
Red Sea reopening: why it matters for MMA and stainless tonne-miles
A sustained reopening of the Red Sea/Suez corridor would be tonne-mile negative for the MMA trade into Europe (and for the specialty chemical tanker market more broadly), because it shortens the key long-haul leg that has been supporting demand. The Red Sea disruption since late 2023 forced many operators to route via the Cape, effectively adding distance and time; Egypt has reported traffic recovering only partially since the October 2025 Gaza ceasefire, and liner operators have been cautious, with some resuming limited transits and others pulling back again amid renewed security concerns. If Red Sea risk premia fade and Asia–Europe parcel ships resume routine Suez routing, the sailing distance on those lanes typically drops by roughly 20–35% versus Cape diversions (trade-route dependent). For the stainless parcel fleet, that distance reduction translates almost one-for-one into lower tonne-miles and released effective capacity (ships return sooner, more voyages per year), which would tend to soften utilization and freight rates—especially on the Europe-bound parcel system where stainless constraints have been most visible. Conversely, if reopening remains fragile—stop-start transits, convoying, higher insurance, occasional re-diversions—then the market keeps a portion of the “extra tonne-mile” benefit while also retaining operational friction that favors owners (longer round voyages and tighter scheduling).
Summary
MMA trade has shifted away from short-haul intra-Asian flows toward longer-haul exports from Asia to Europe and North America, driven by China’s rise as the dominant exporter and reduced balancing supply from other Asian producers. Although global export volumes have grown only modestly, average haul lengths have increased materially, lifting tonne-mile demand and tightening effective supply in the chemical tanker market.
This effect is most evident in the specialty chemical tanker segment, where long-haul MMA movements are typically executed as parcel trades alongside other high-spec chemicals, drawing on stainless steel tonnage. A full reopening of the Red Sea would reduce tonne-miles on Asia–Europe routes and ease this support, but absent that, current MMA trade patterns remain structurally positive for chemical tanker demand.
By Plamen Aleksandrov, Head of Research, Chemicals, SSY
Articles
You may also be
interested in
View all


Get in touch
Contact us today to find out how our expert team can support your business